Contents
Spring 2017
This 4-unit course quantitatively evaluates all aspects of the water cycle. In spring 2017, the course was listed as a Data Science Capstone for Berkeley’s new Data Science Initiative. Students who take this class gain experience with hydrologic modeling and data analysis using Python (see example exercises and tutorials below). Throughout the semester, we engaged in a partnership with the Institute for Disease Modeling, using the case-study of hydrologic modeling to support projections of malaria transmission in Burkina Faso as a theme of study through the semester. For their final projects, students worked in teams to improve the representation of specific hydrologic processes in a model that the Institute for Disease Modeling is using in support of their efforts to eradicate malaria. Ph.D student Mollie van Gordon served as the GSI for the class and played a critical role in its success.
Exercises and Tutorials in Jupyter Notebook
Jupyter Notebook is emerging as a powerful tool for teaching and collaborative coding. In the interest of open science/teaching/computing, here are the html versions notebooks we used in class exercises and assignments. The answer keys will be made available to other educators upon request. The .ipynb source files are available from Github.
Exercises
- Water balance models with spreadsheets: Mono Lake case study: Using actual historical data from Mono Lake, CA, and employing some simplifying assumptions, students calculate the lake level and salinity of Mono Lake at past and future dates, based on measured and regulated inflows and modeled evapotranspiration rate.
- Water balance models in Python: Mono Lake Case study, continued: Students convert the spreadsheet-based Mono Lake model into a simple program in Python.
- Extreme rainfall, climate change, and evapotranspiration: In the first part of the assignment, students use the Clausius-Clapeyron relationship to quantify expected increases in rainfall with increased temperature. In the second part of this assignment, students work with a model of how evaporation influences mosquito habitat. This part of the assignment requires files from our partners at the Institute for Disease Modeling, which must be requested formally.
- Hydrologic mapping: watersheds and spatial interpolation: Students delineate (by hand) nested watersheds from a topographic map. They then use Jupyter Notebooks (see file here) to spatially interpolate data from multiple rain gages and generate hyetograms from the watershed.
- Strawberry Creek discharge assignment: Students use floats, dye, an acoustic Doppler velocimeter, and salt dilution gauging as alternative methods to calculate the discharge of Strawberry Creek, which runs through the campus of UC Berkeley. Students also learn to read a staff gauge. See Strawberry Creek data and photos here!
- How rare was the flood that broke the Oroville Dam spillway? Students use a dataset from the Feather River just below the Oroville Dam to compute the frequency of the flow event that breached the dam’s spillway in 2017. In part II of the assignment, students interpret a Python model of how streamflow influences mosquito habitat. This part of the assignment requires files from our partners at the Institute for Disease Modeling, which must be requested formally.
- Groundwater and the Woburn Toxics Trial: Students act as investigative hydrogeologists in modeling potential contamination plumes using data from the Superfund case behind the book and movie A Civil Action. They are introduced to spatial modeling in Python and deepen their expertise in performing regression analysis and using functions. They also gain experience in working with the Cooper-Jacob equation and Theim equation. This exercise is based on a similar spreadsheet-based exercise found here.
Tutorials
- Getting started: prepare for scientific computing: Students get set up with Anaconda and Jupyter Notebooks and learn some basic principles of programming.
- Introduction to Jupyter Notebooks: Setting up a notebook for scientific computing, with a general example.
- Modules and the Clausius-Clapeyron equation: Students learn how modules work in python and explore absolute and relative humidity, using weather data from the current day.
- Precipitation frequency analyses: Students learn how to read data from a file into Python. Here they work with precipitation gauge data from Niger. They generate histograms of hourly, daily, and annual rainfall and perform Weibull and Gumbel frequency analyses.
- Incremental stream discharge calculations and for-loops: Students learn alternative ways to perform stream discharge calculations using the incremental area approach with for-loops, contrasted with array operations. This tutorial is a supplement to the Strawberry Creek discharge assignment.
- Manipulating the Cooper-Jacob equation to solve for storativity and transmissivity: Handwritten notes designed to supplement the Groundwater and the Woburn Toxics Trial assignment.
Photos from Class Presentations
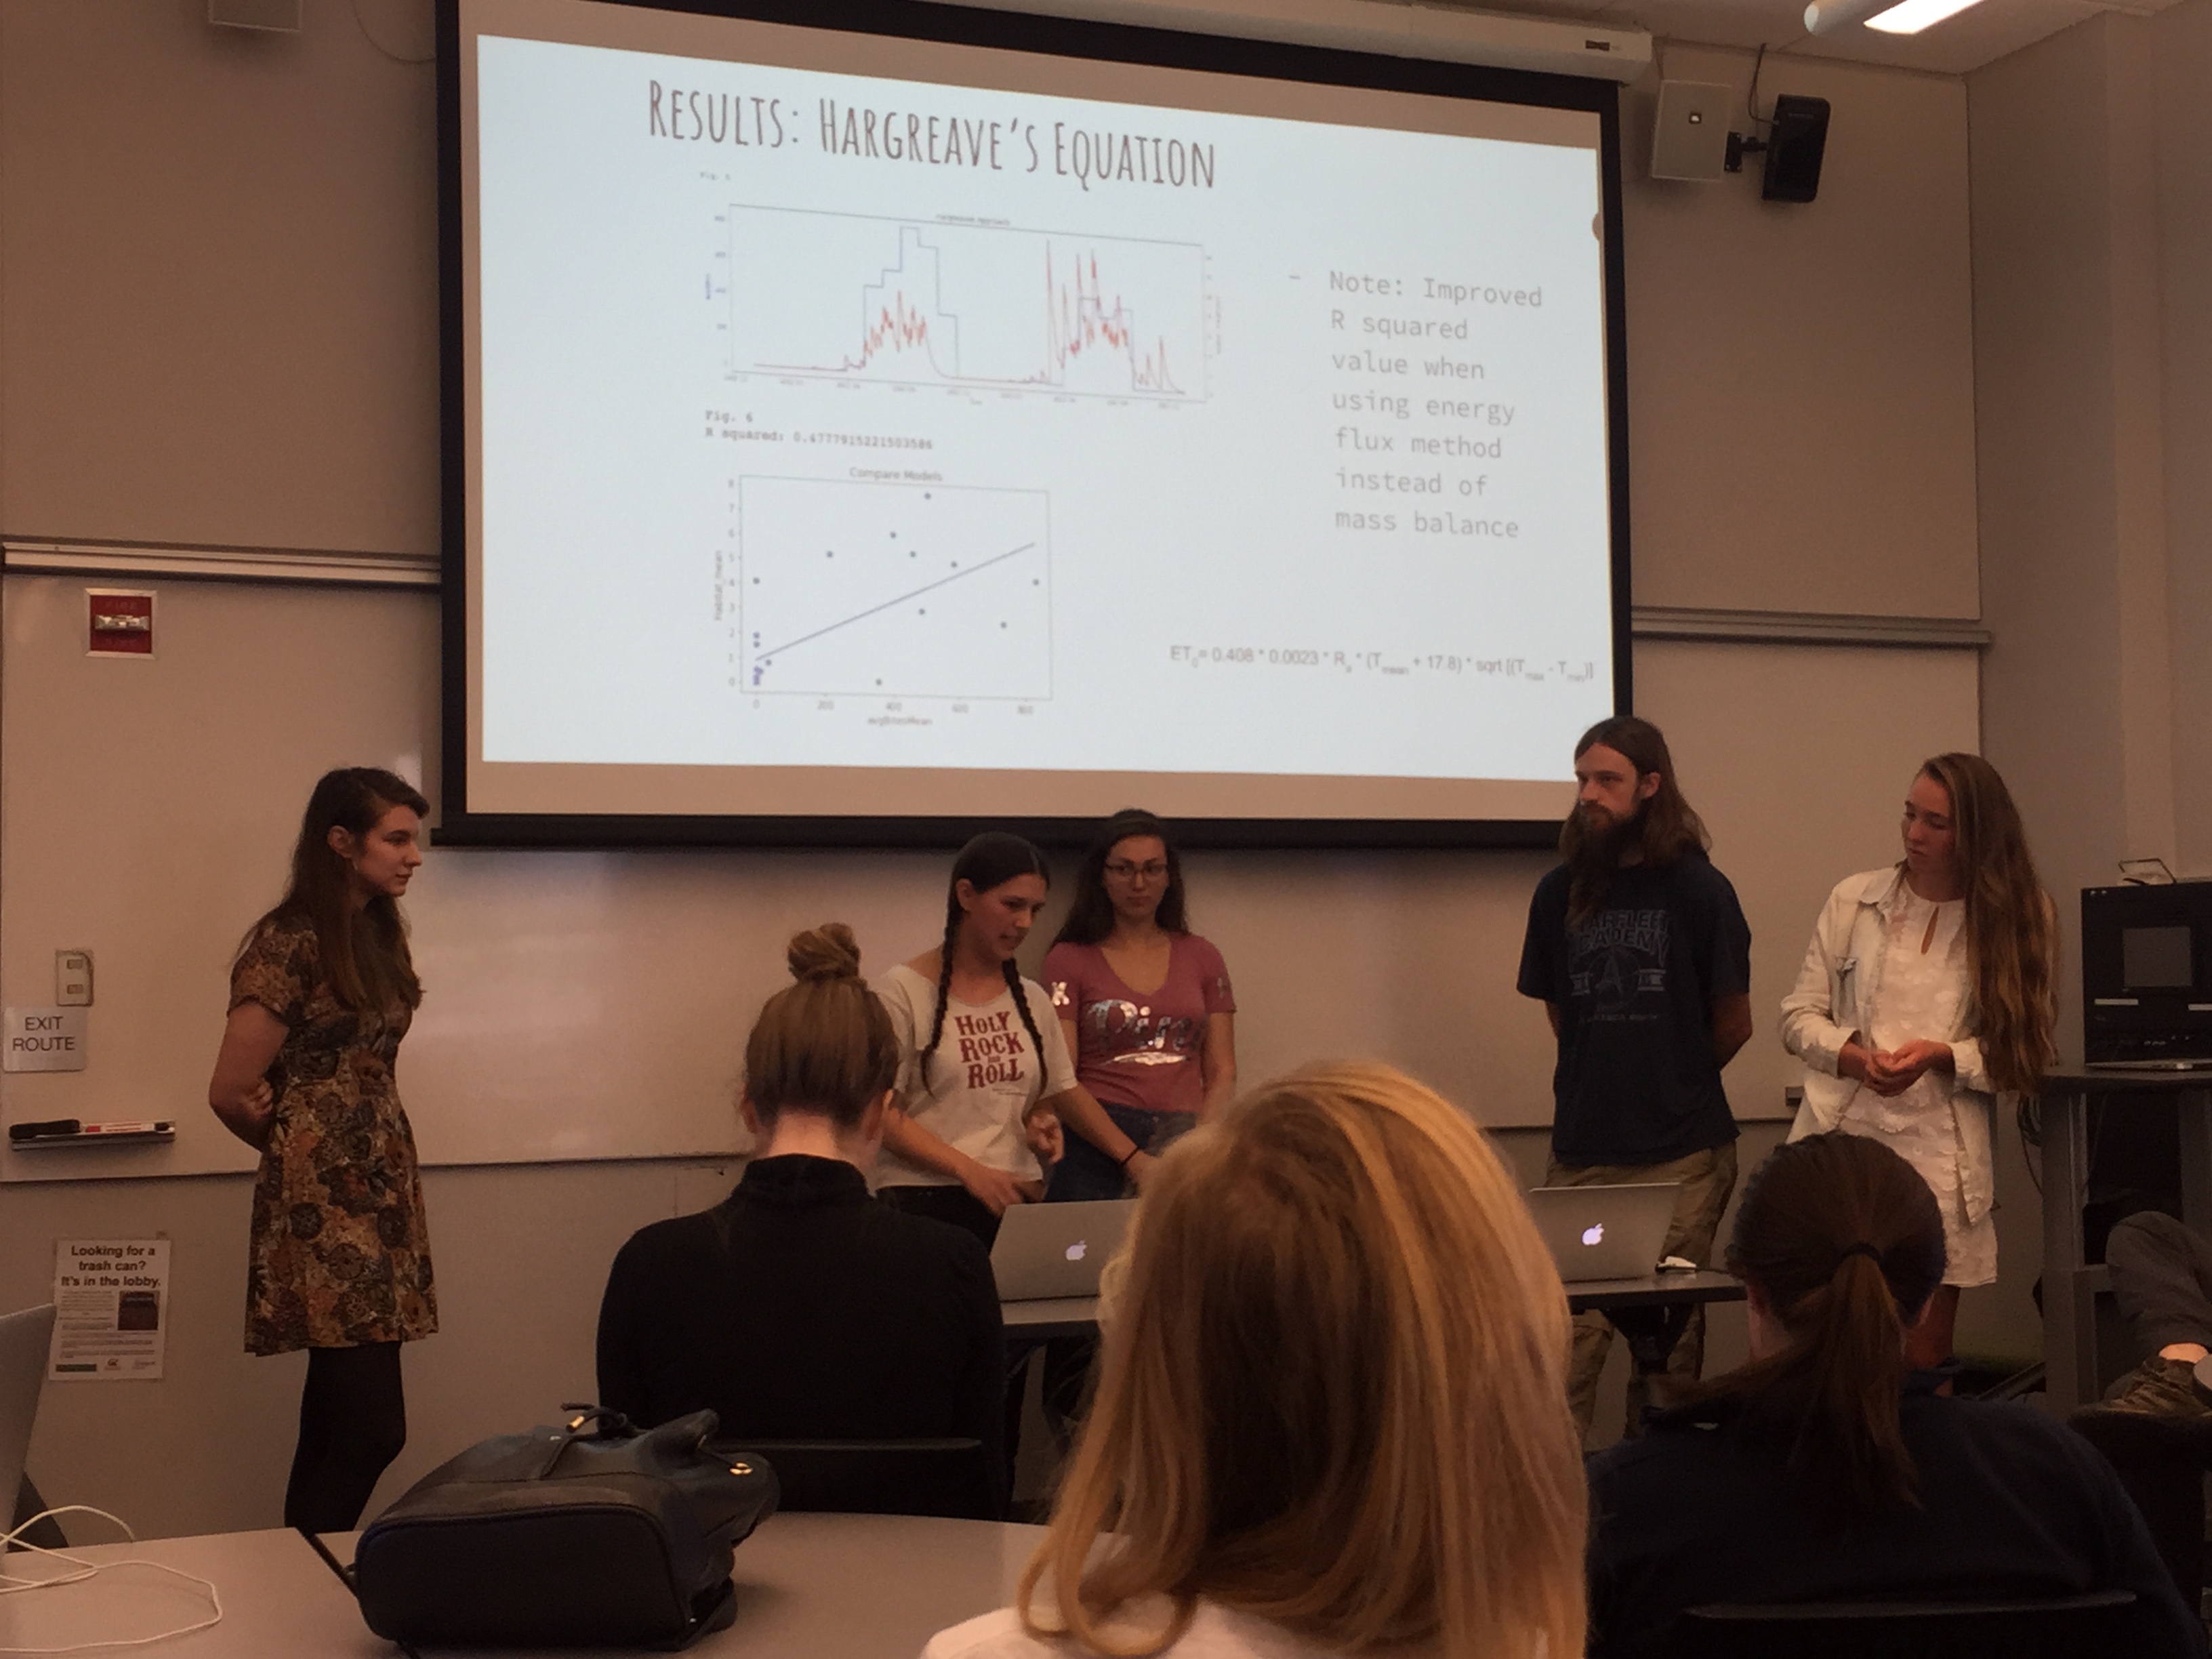
On the last day of class, the three teams of students presented their work on modeling malaria hydrology.
One team compared the ability of different models to tackle evapotranspiration at regional scales:
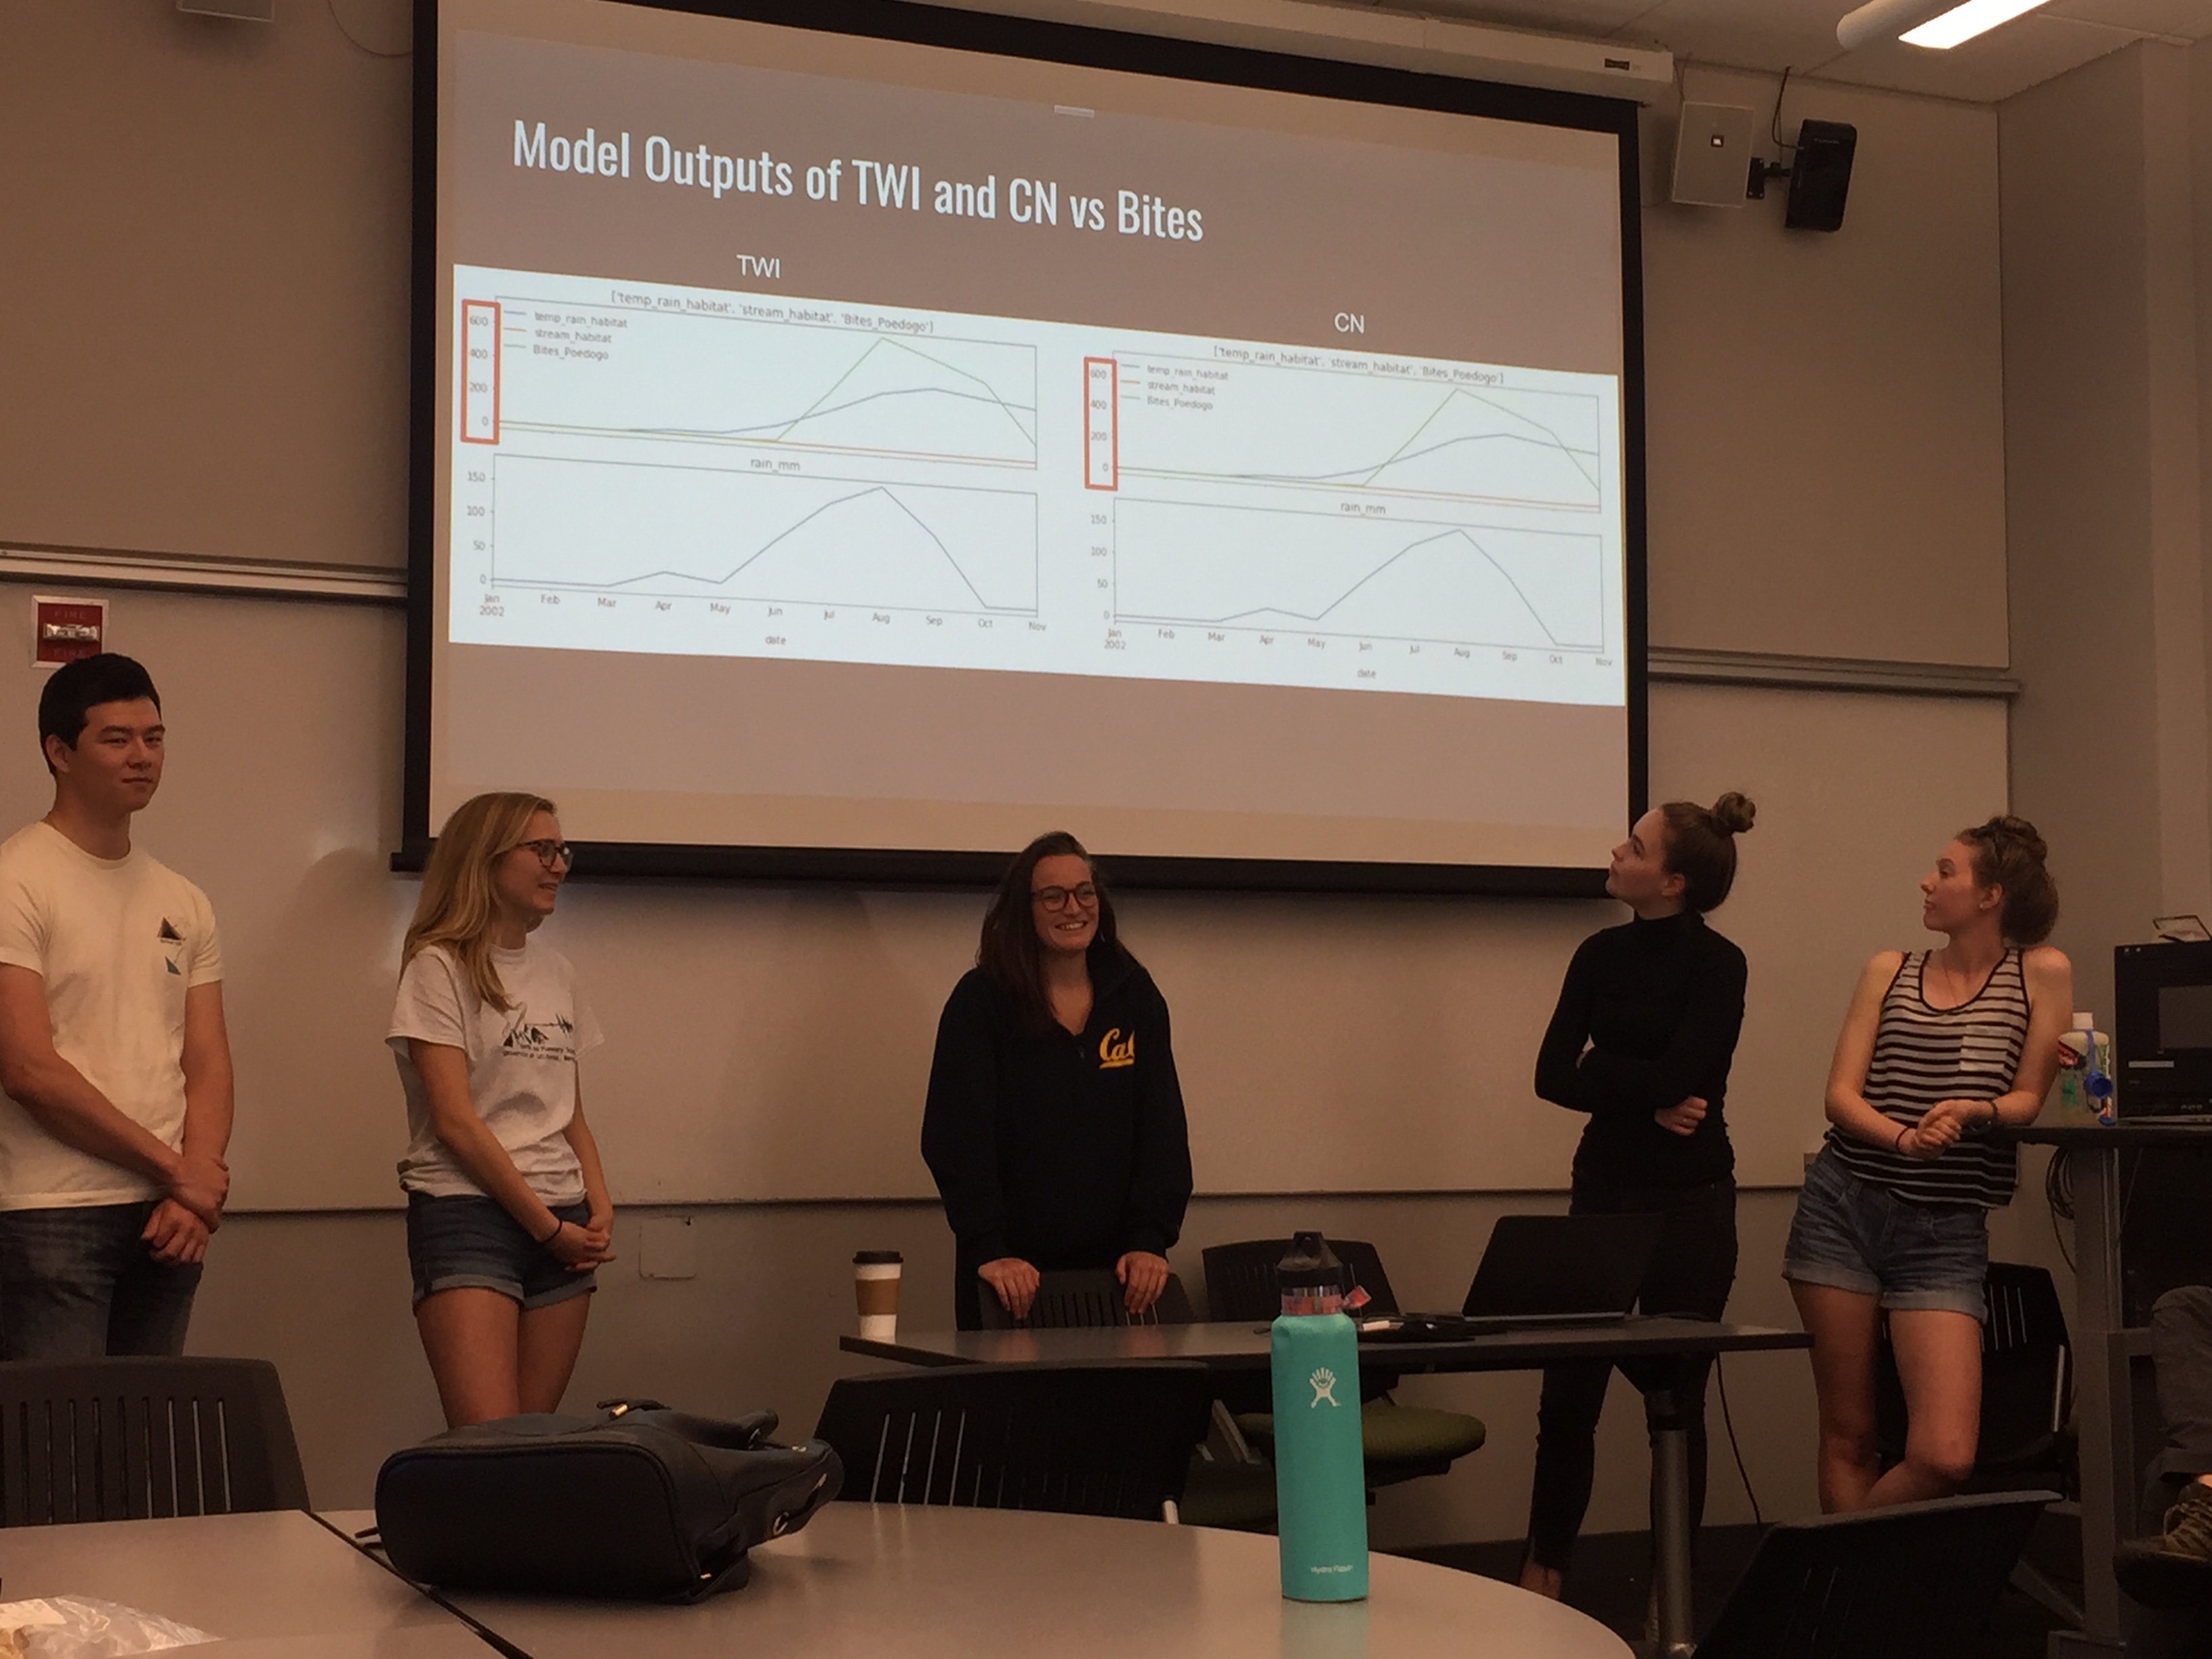
Another team tackled the challenge of representing overland flow and its implications for streamside and temporary habitat:
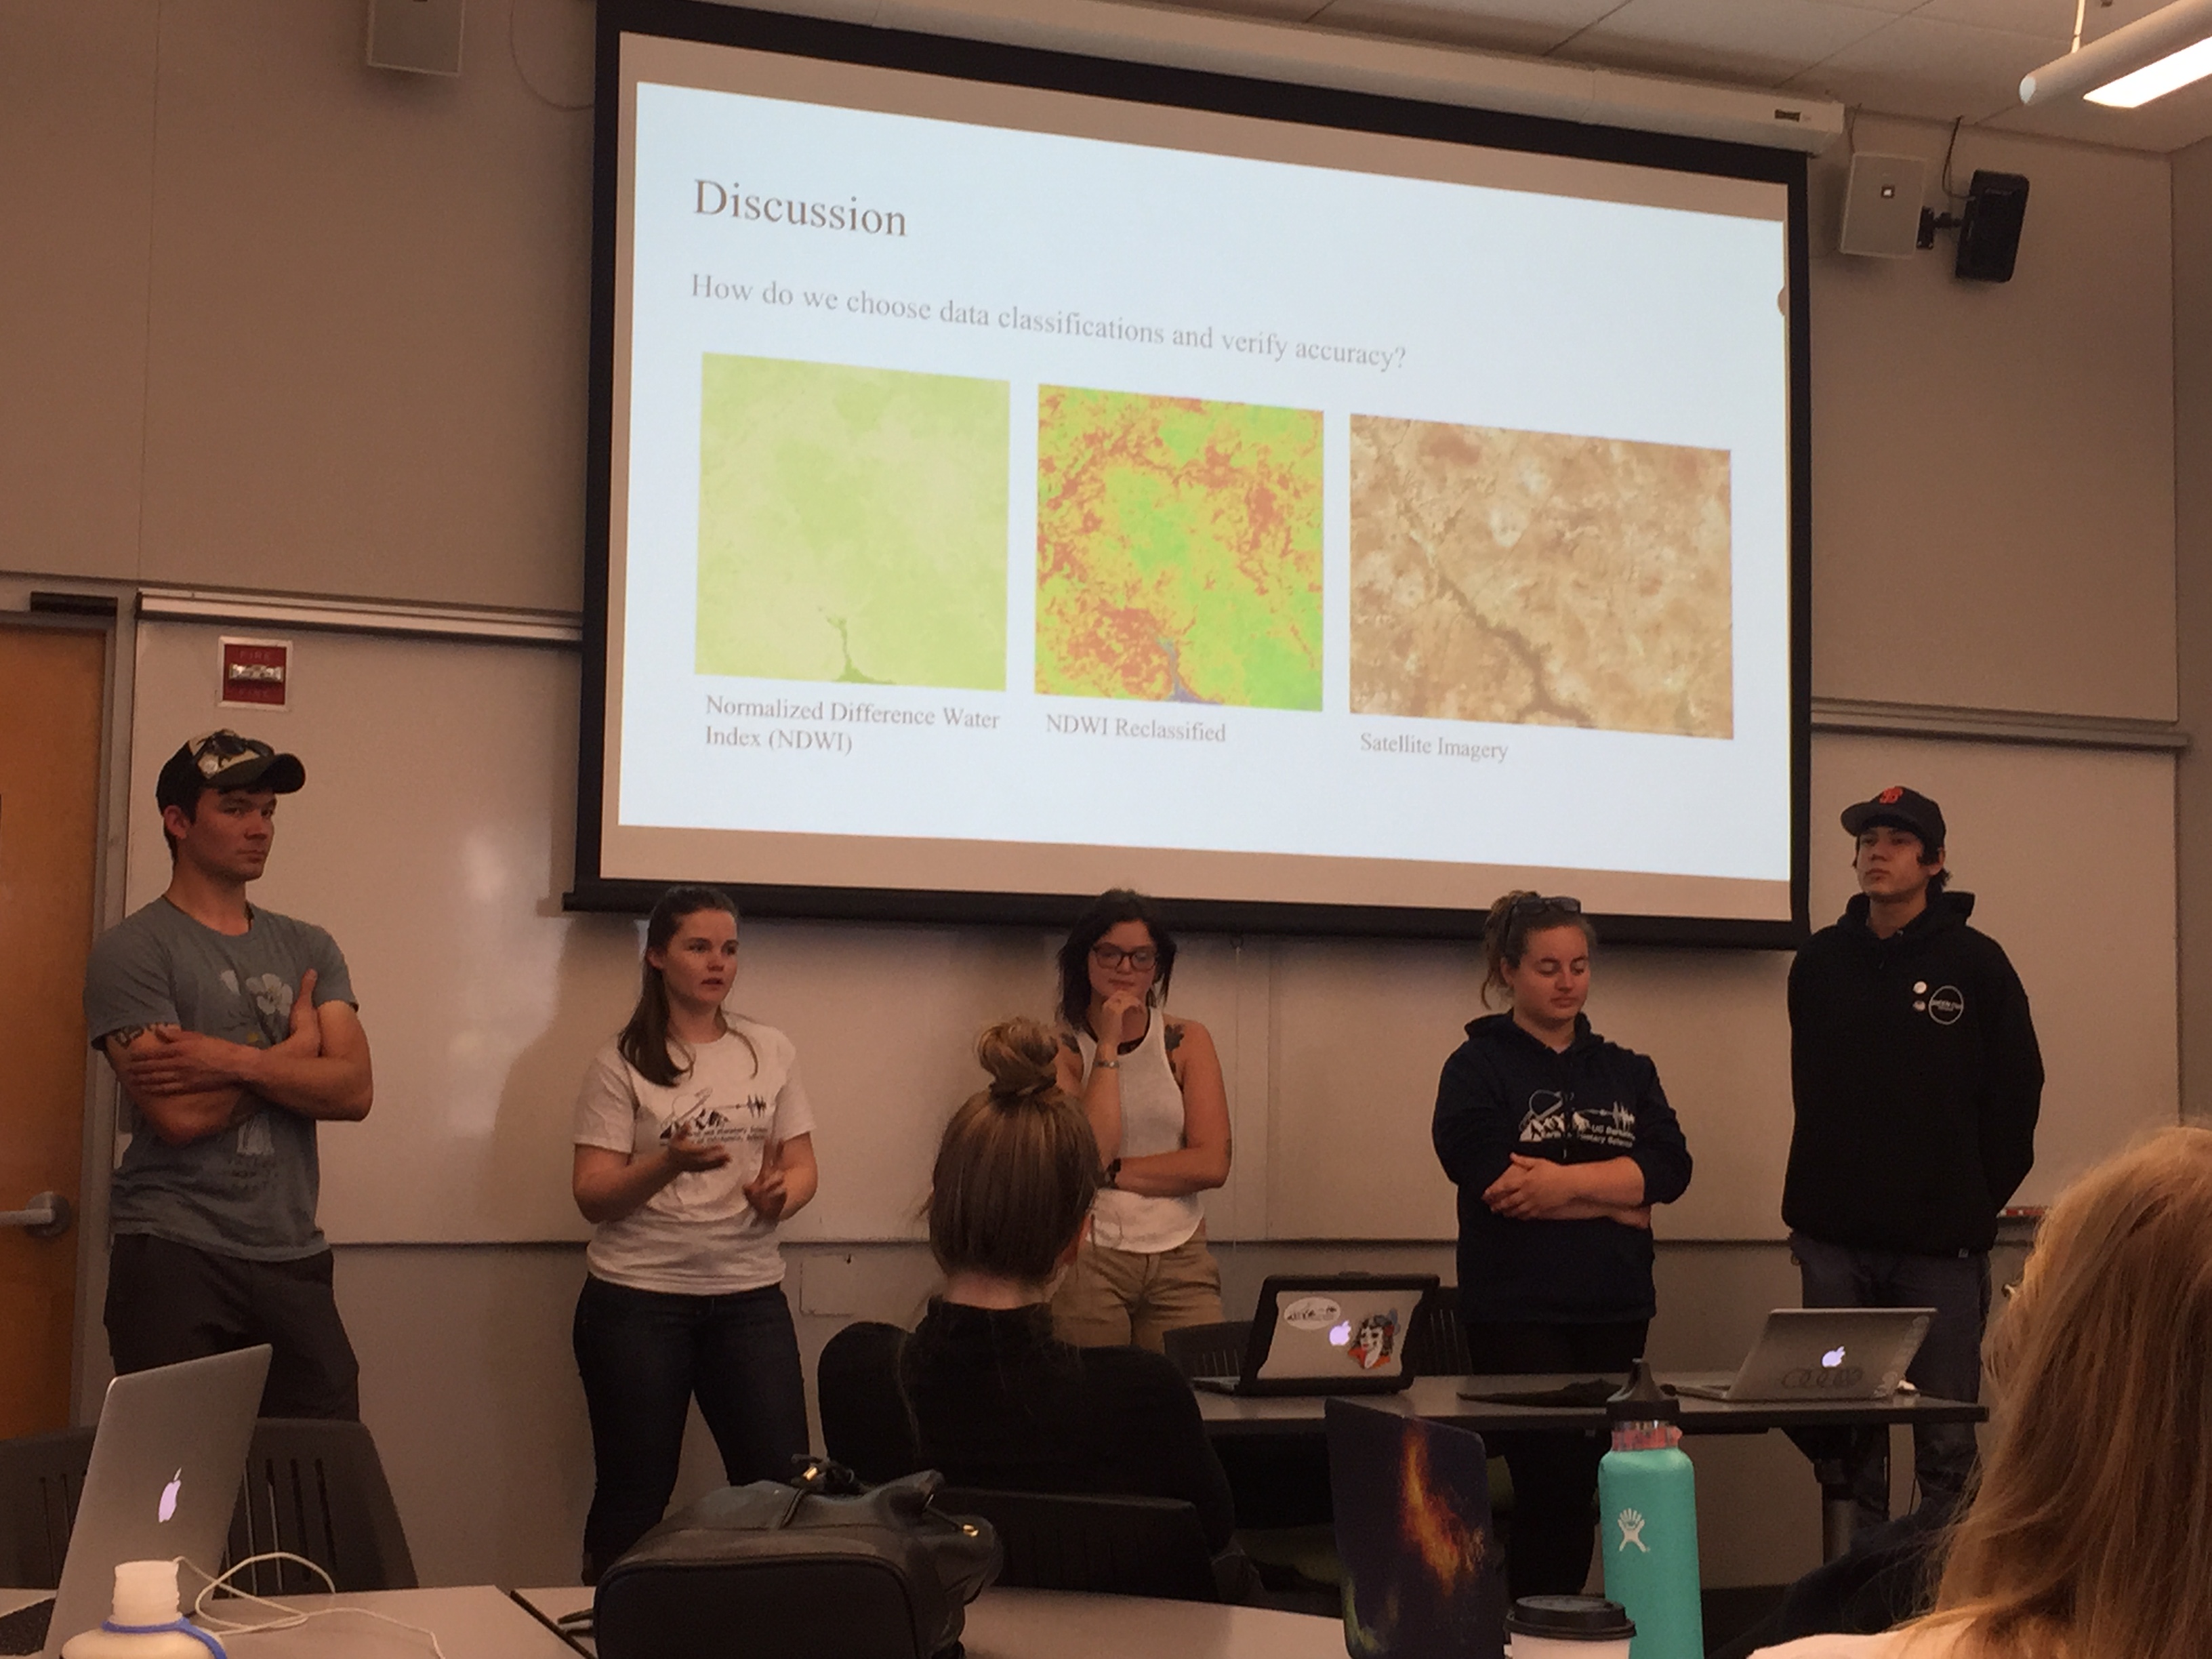
The third team tackled the influence of topography on the ponding of water in depressions:
All of this work will make valuable contributions to the challenge of modeling the hydrology of malaria transmission over large spatial scales!